i² Platform

In the core

My Production & Leaderboards

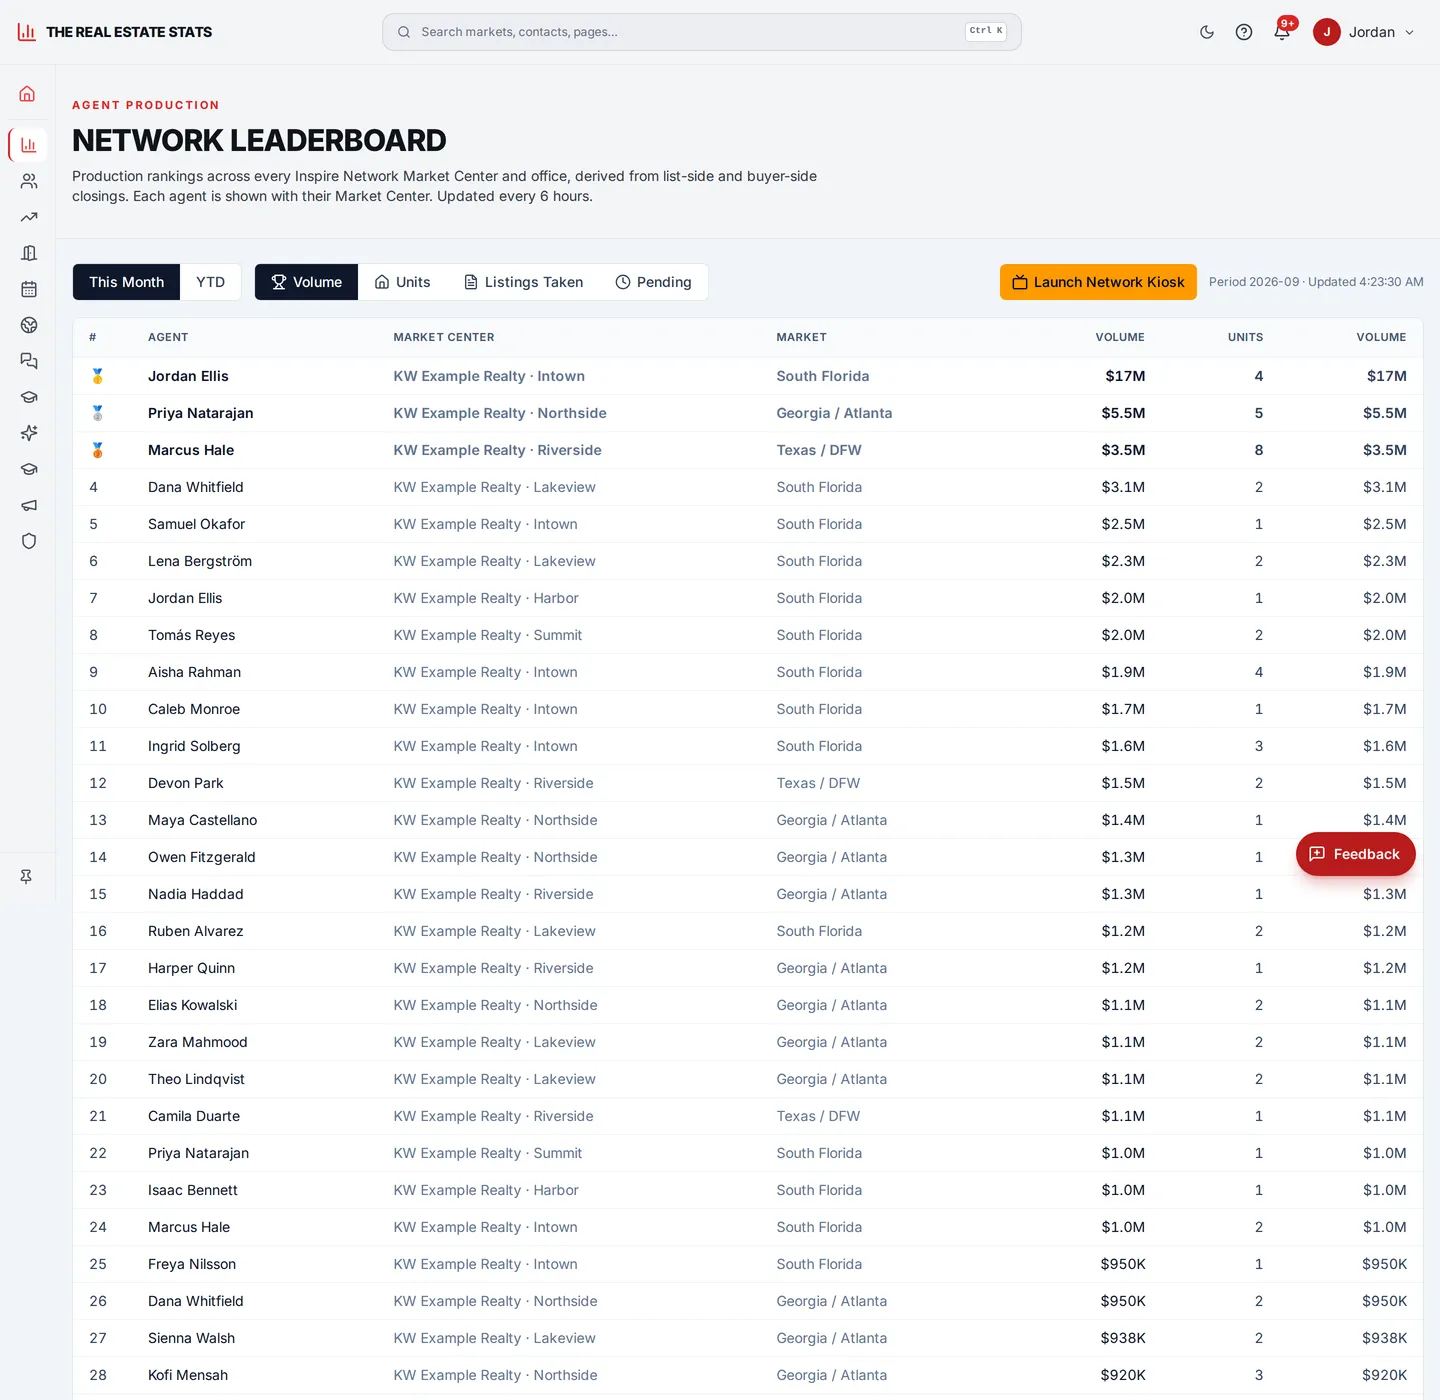
Every agent's closed sides, volume, list/buy split, average price, and pace — from their linked MLS identity, with no data entry. Leadership sees the office, the state, and the network.

The agent's own dashboard

Trailing-twelve and year-to-date production, monthly units and volume charts, milestones and recognitions the moment a closing posts (Georgia closings land about two weeks after the fact, and the dashboard says so instead of pretending).
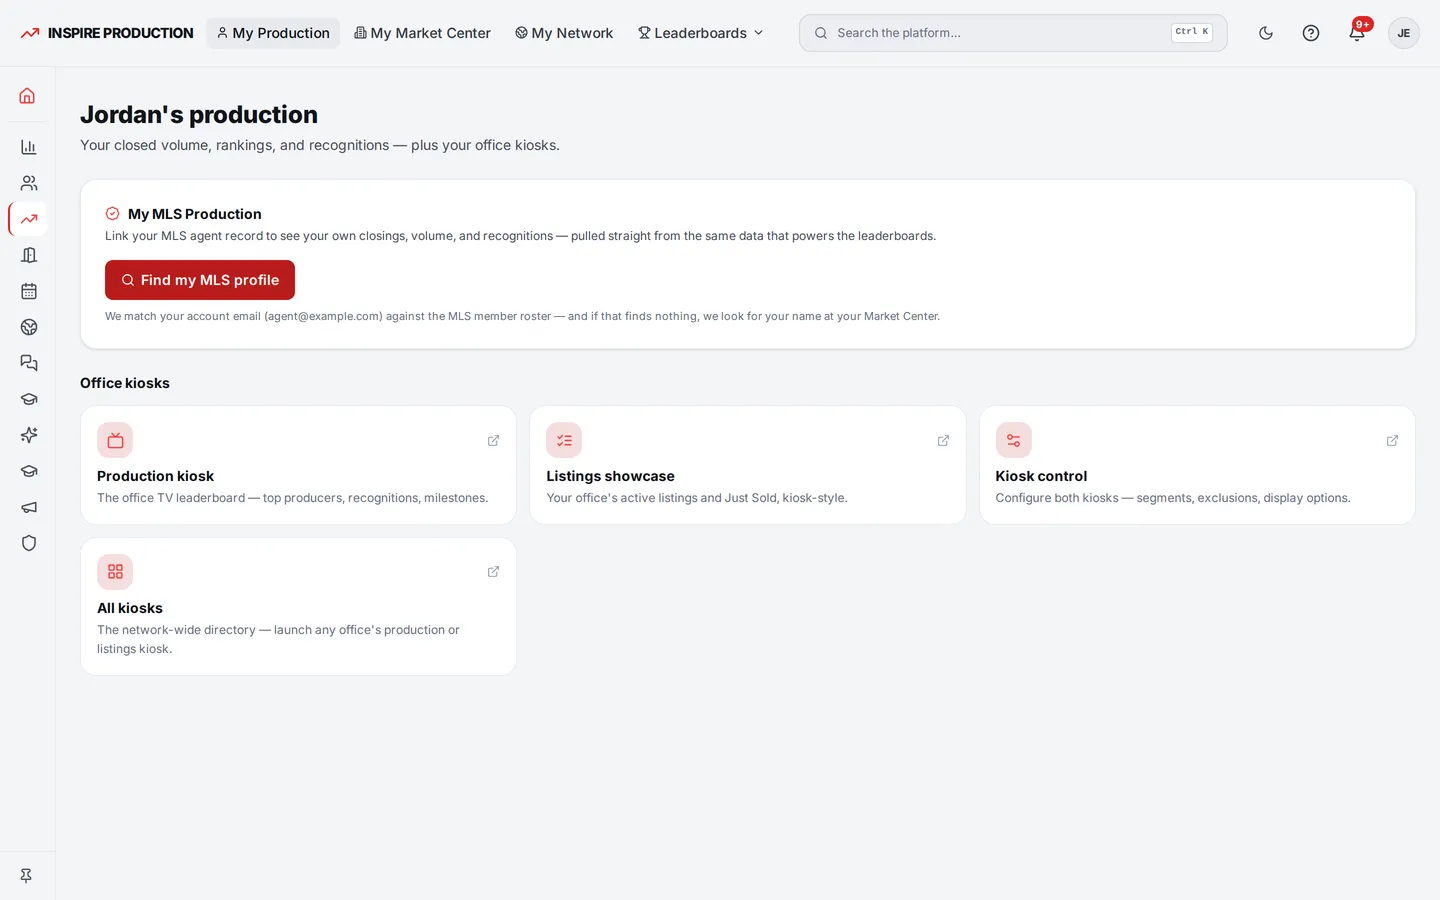
My Production — sides, volume, list/buy split, pace

My Market Center, My Network

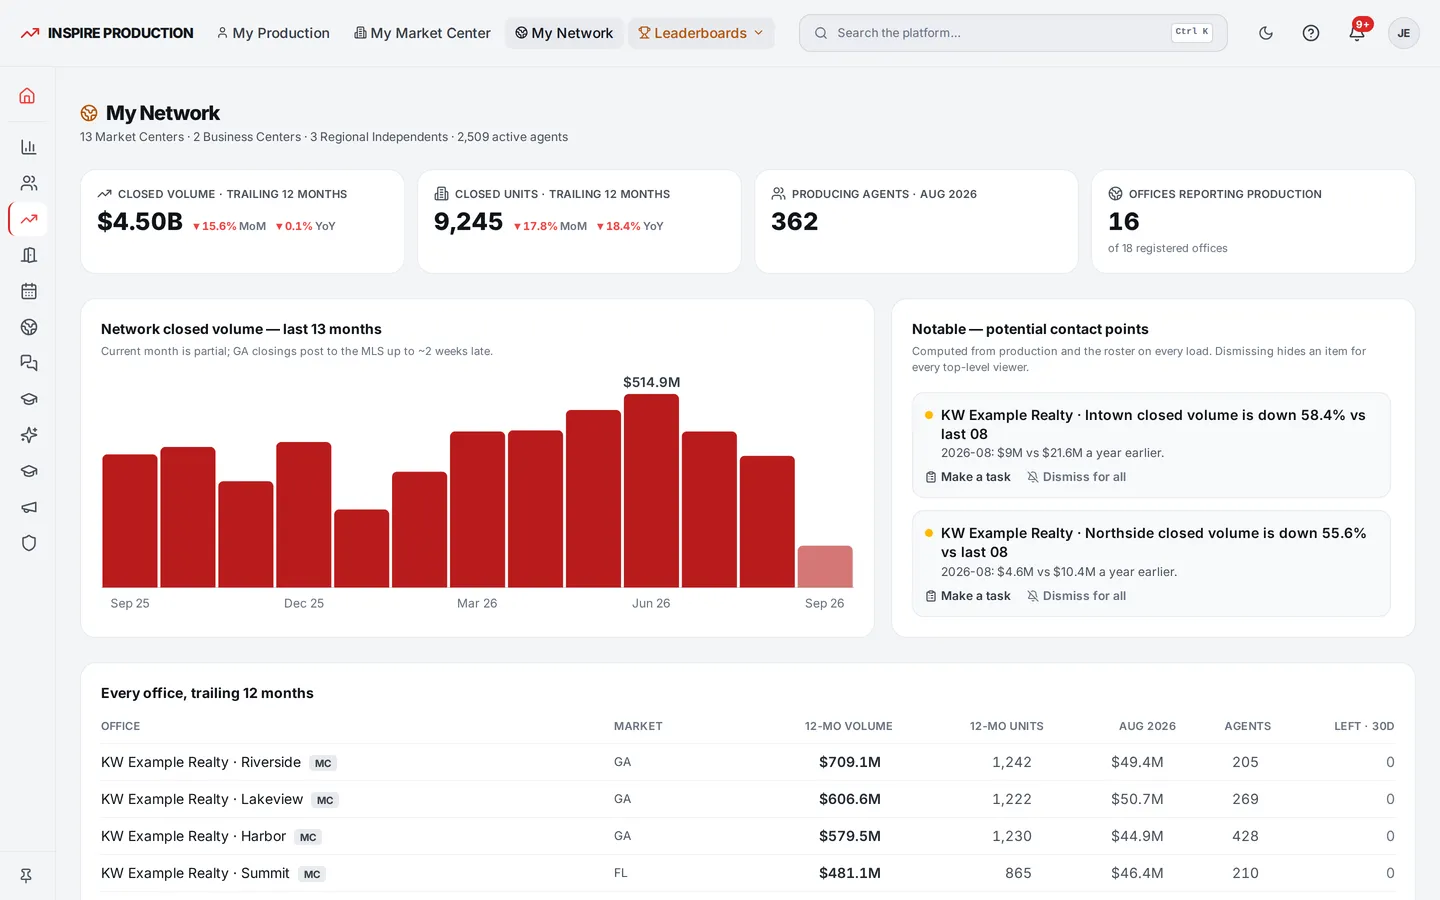
A Team Leader or MCA opens their office — every agent's production, scoped to that roster. Top-level leadership opens the whole network on one page: production by Market Center, month by month, against the MLS itself. When a month is re-aggregated, stale attribution drops out rather than lingering.

My Network — every Market Center on one page

Leaderboards at every level

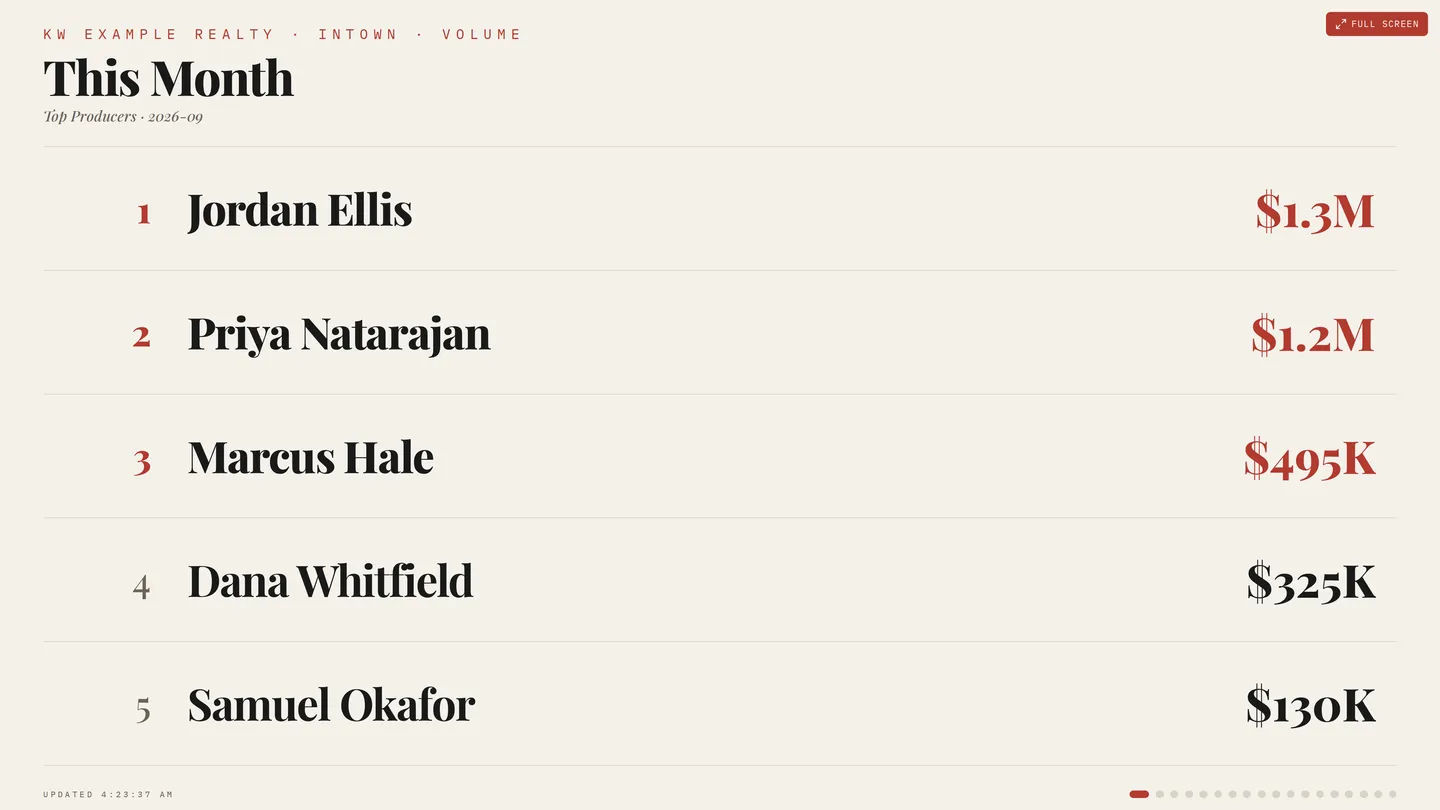
Network, Market Center, and state leaderboards by sides and volume, with the office kiosk view that runs on a lobby screen and refreshes itself every fifteen minutes. Agents appear under the name they go by in the CRM, not the legal name on their MLS record.

Network leaderboard — volume, units, listings taken, pending
Office kiosk — the leaderboard on the lobby screen

Recognition exports

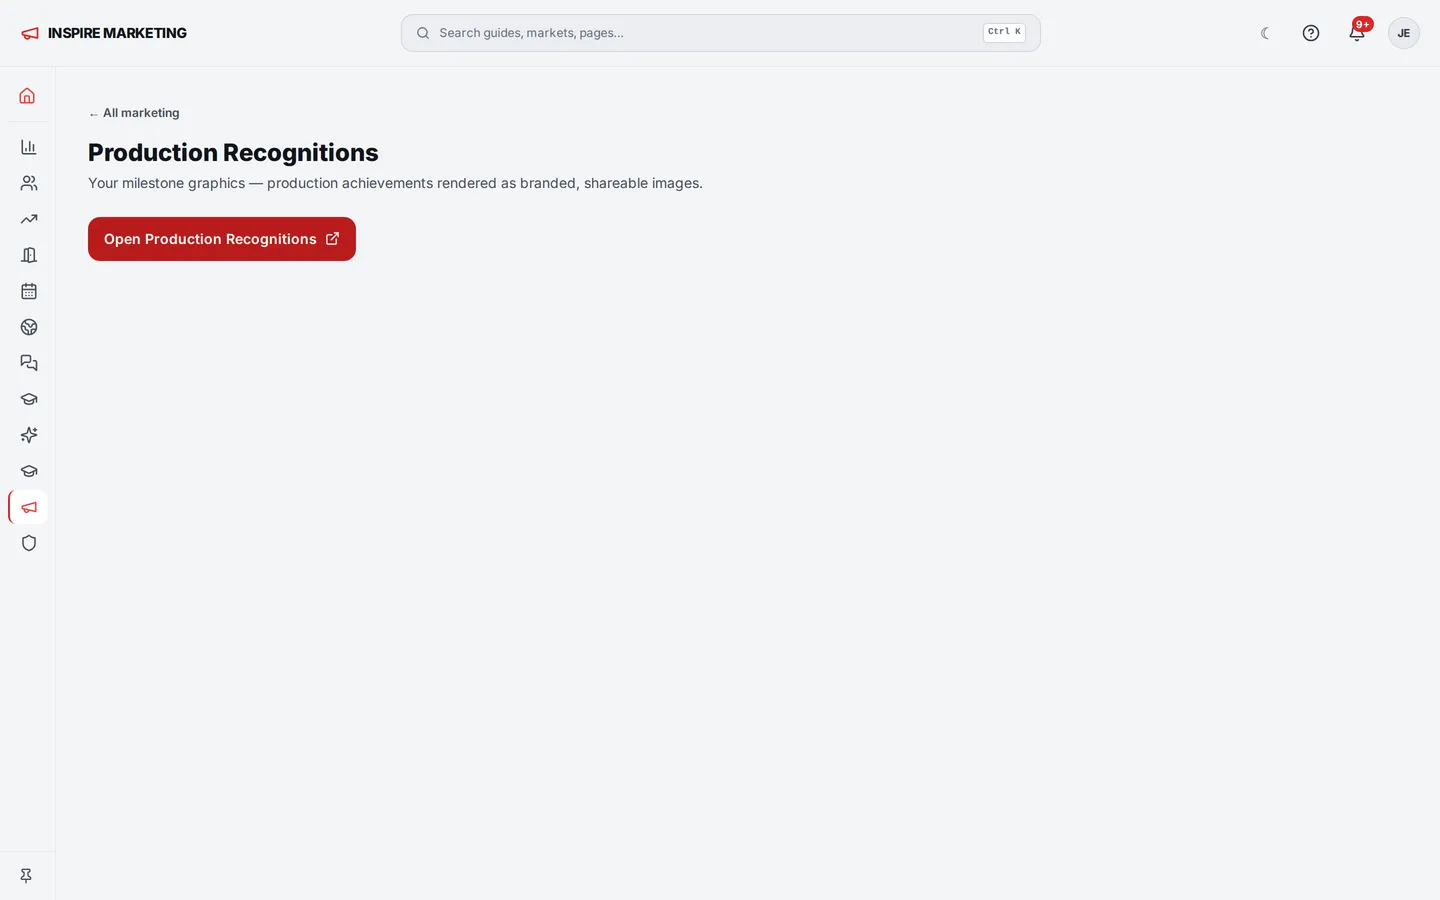
Production recognitions as shareable images and one-pagers in the office's branding — ready for social or the wall.

Recognitions as shareable graphics

See My Production & Leaderboards on your own boards’ data.

Screens above are the live platform with a generic office and cast. A walkthrough shows it on your feeds.

Book a walkthroughNext: Content & Education →