In the core
The market's record, from the MLS itself — every county, city, and zip on your boards, recomputed from raw listings, never scraped. Deep enough to answer the question an agent actually gets asked, current enough to be trusted in a listing appointment.
Every listing from every board you're on, every status, every field, back as far as each feed allows. Stats are recomputed from that record, so a number on a page can always be traced to the listings behind it. When a board revises history, the stats follow.
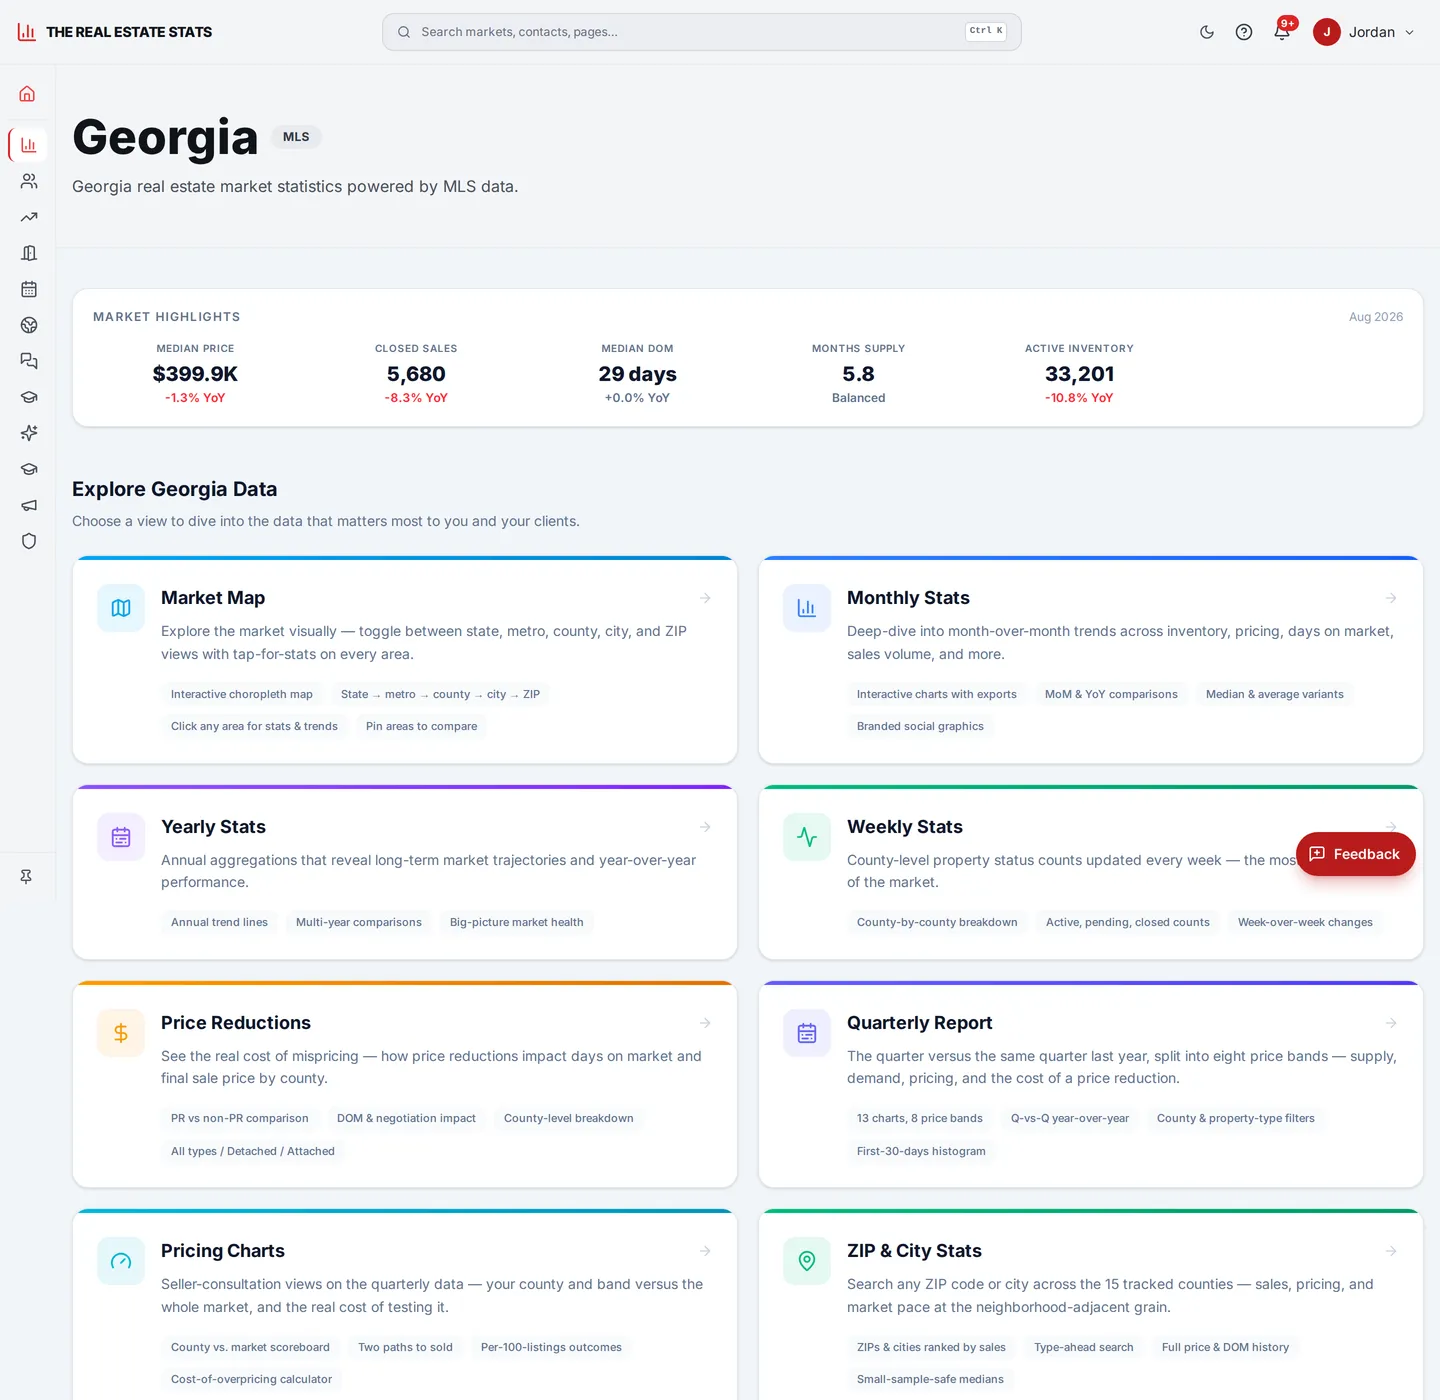
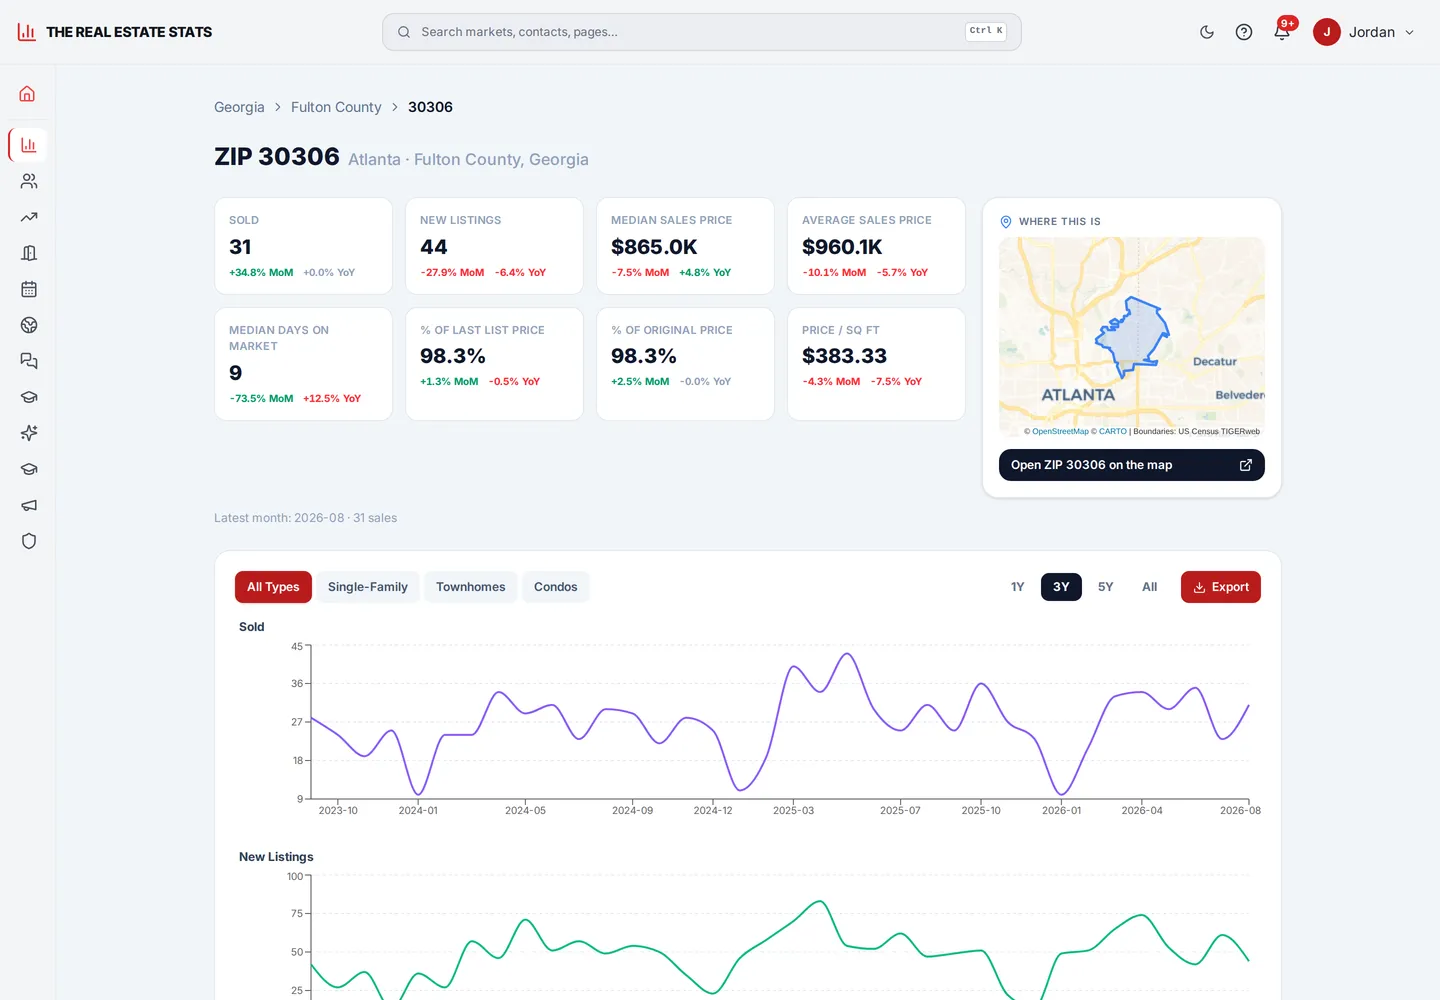
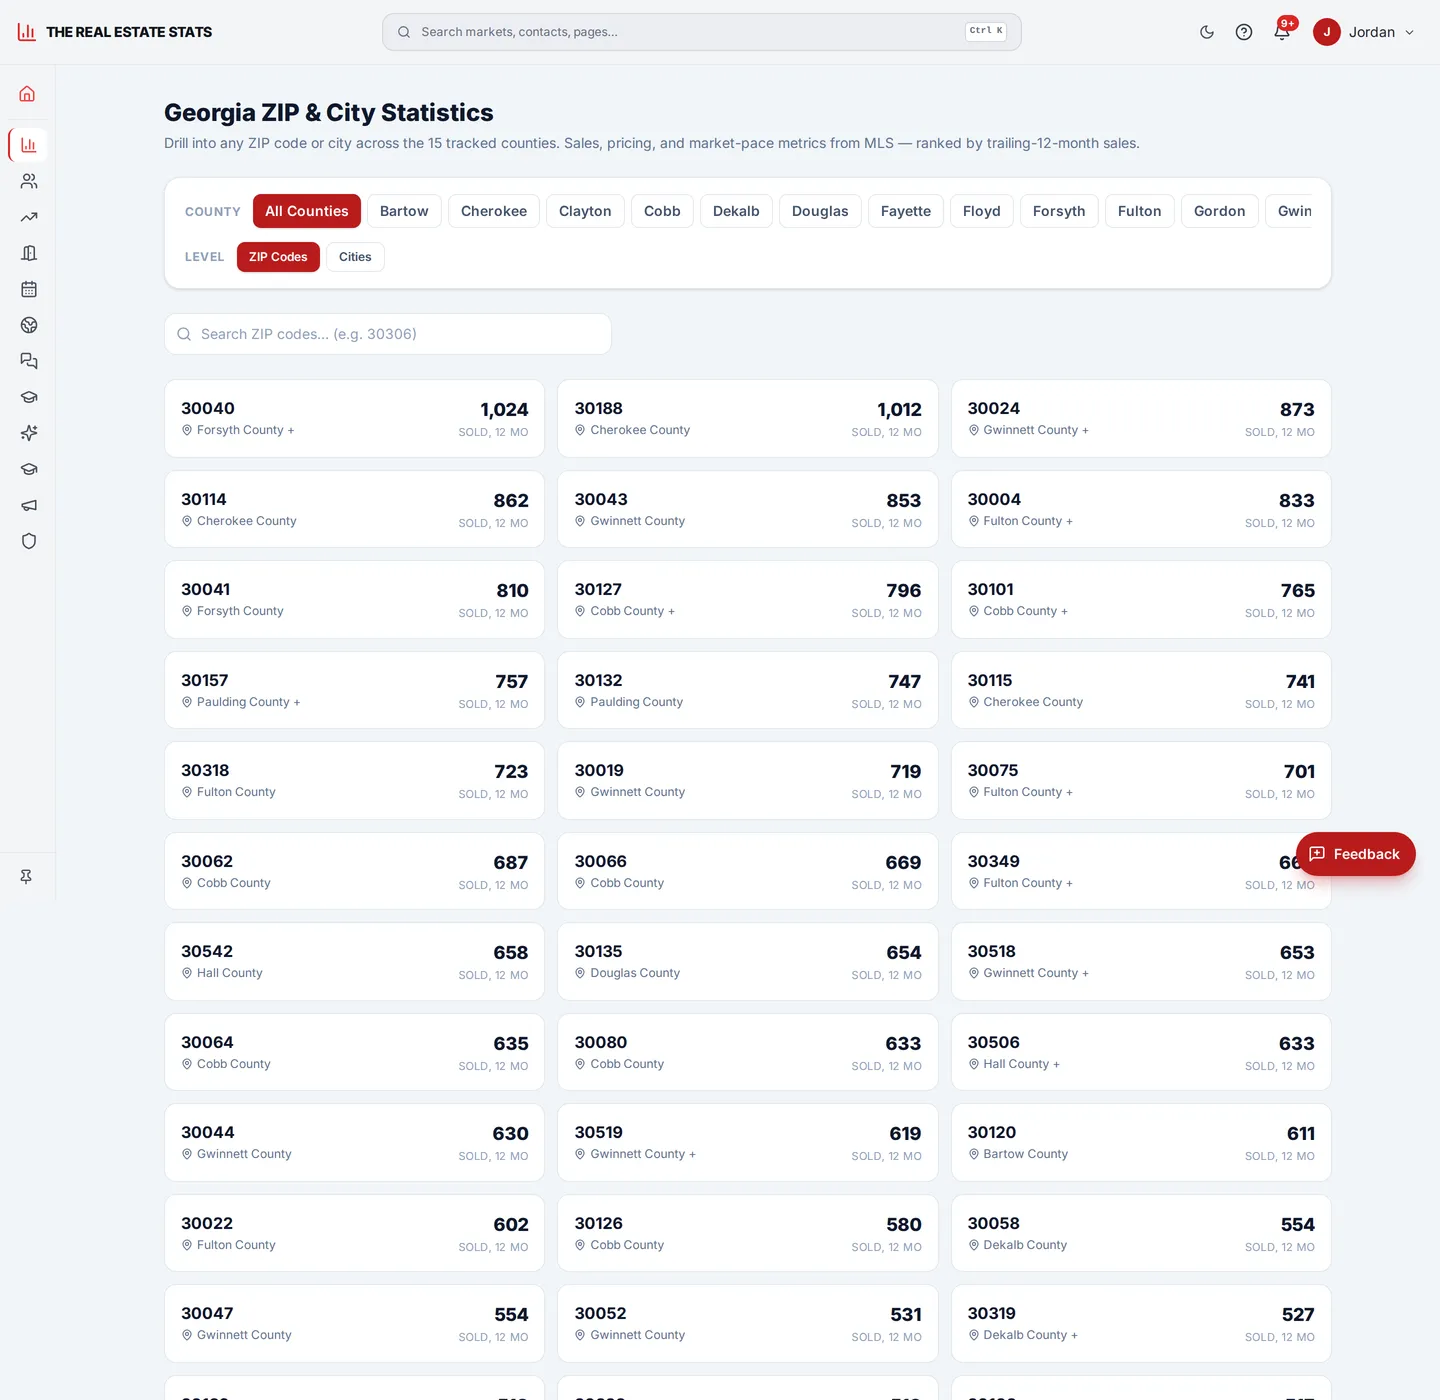
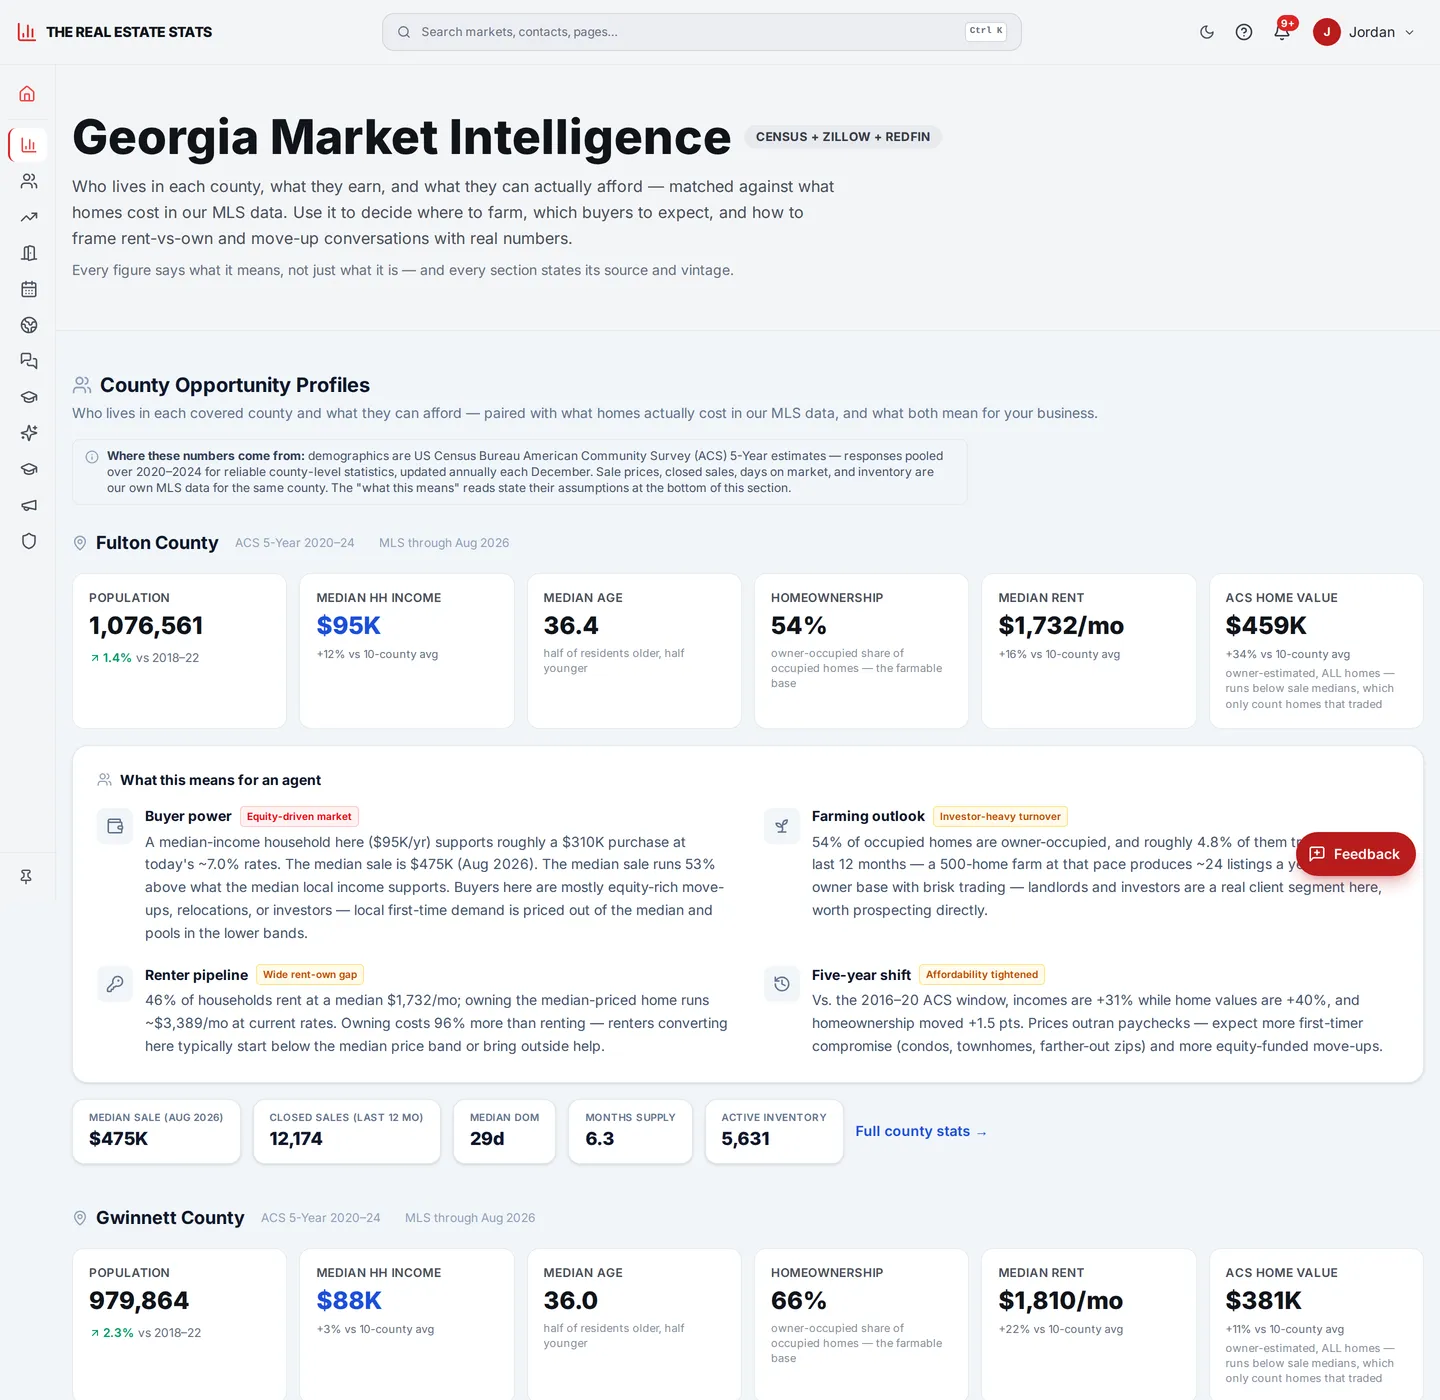
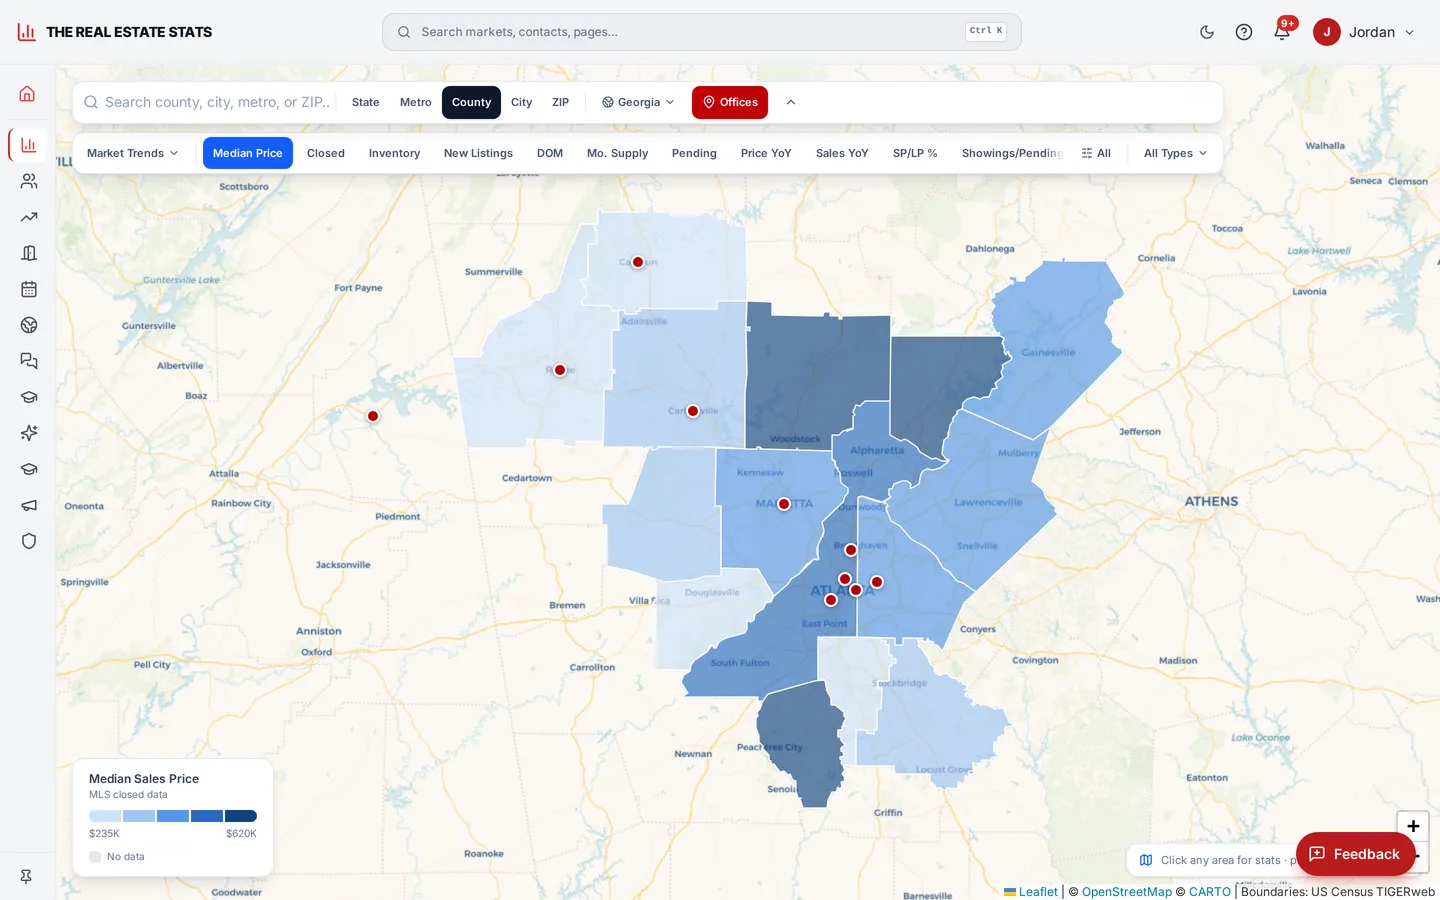
A state hub with the statewide picture; every county; every city and zip with enough sales to be honest (medians are suppressed under five closings rather than reported), each with its boundary drawn on a street map so you can see where it is. County groups — a metro core, a ring of suburbs — are pooled properly, never an average of averages.


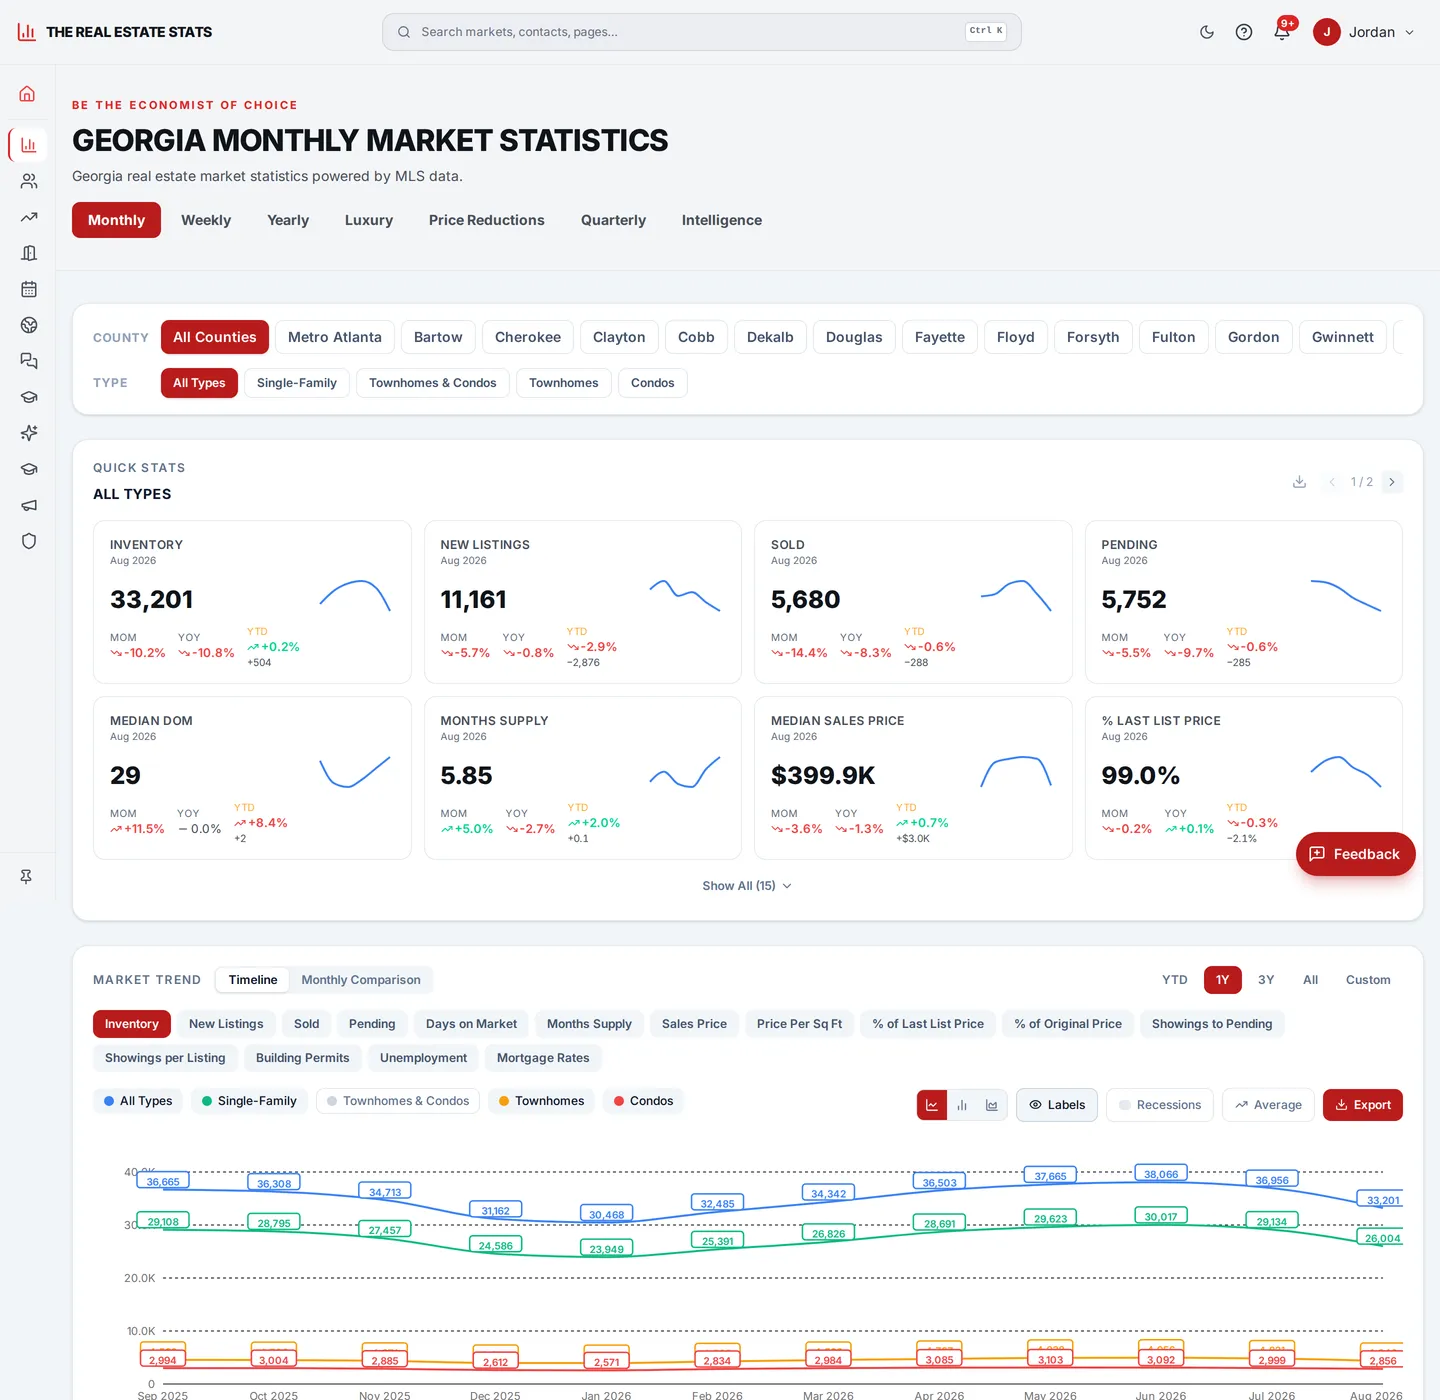
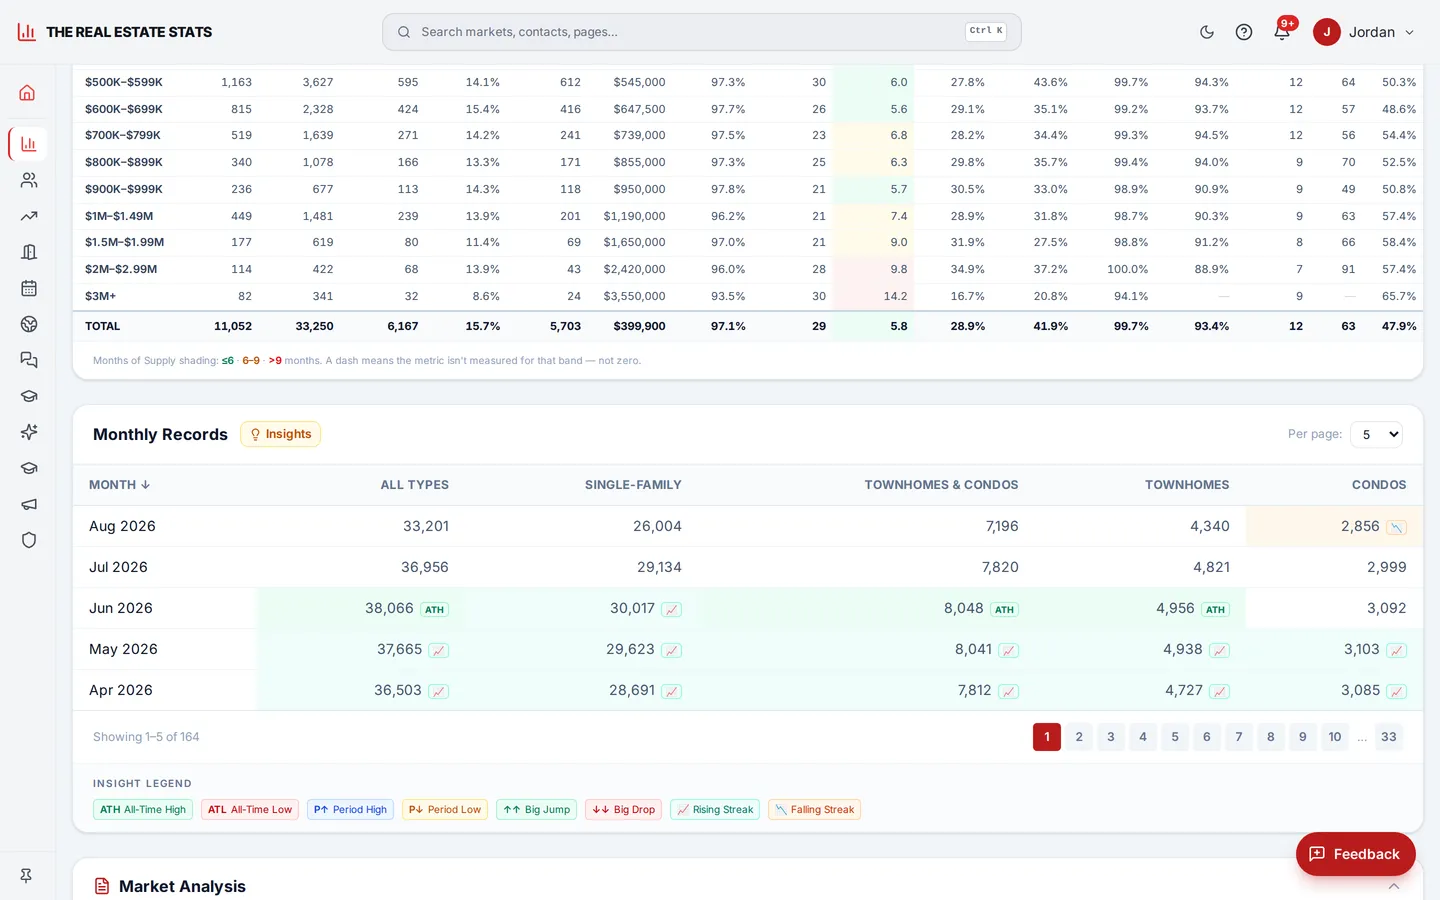
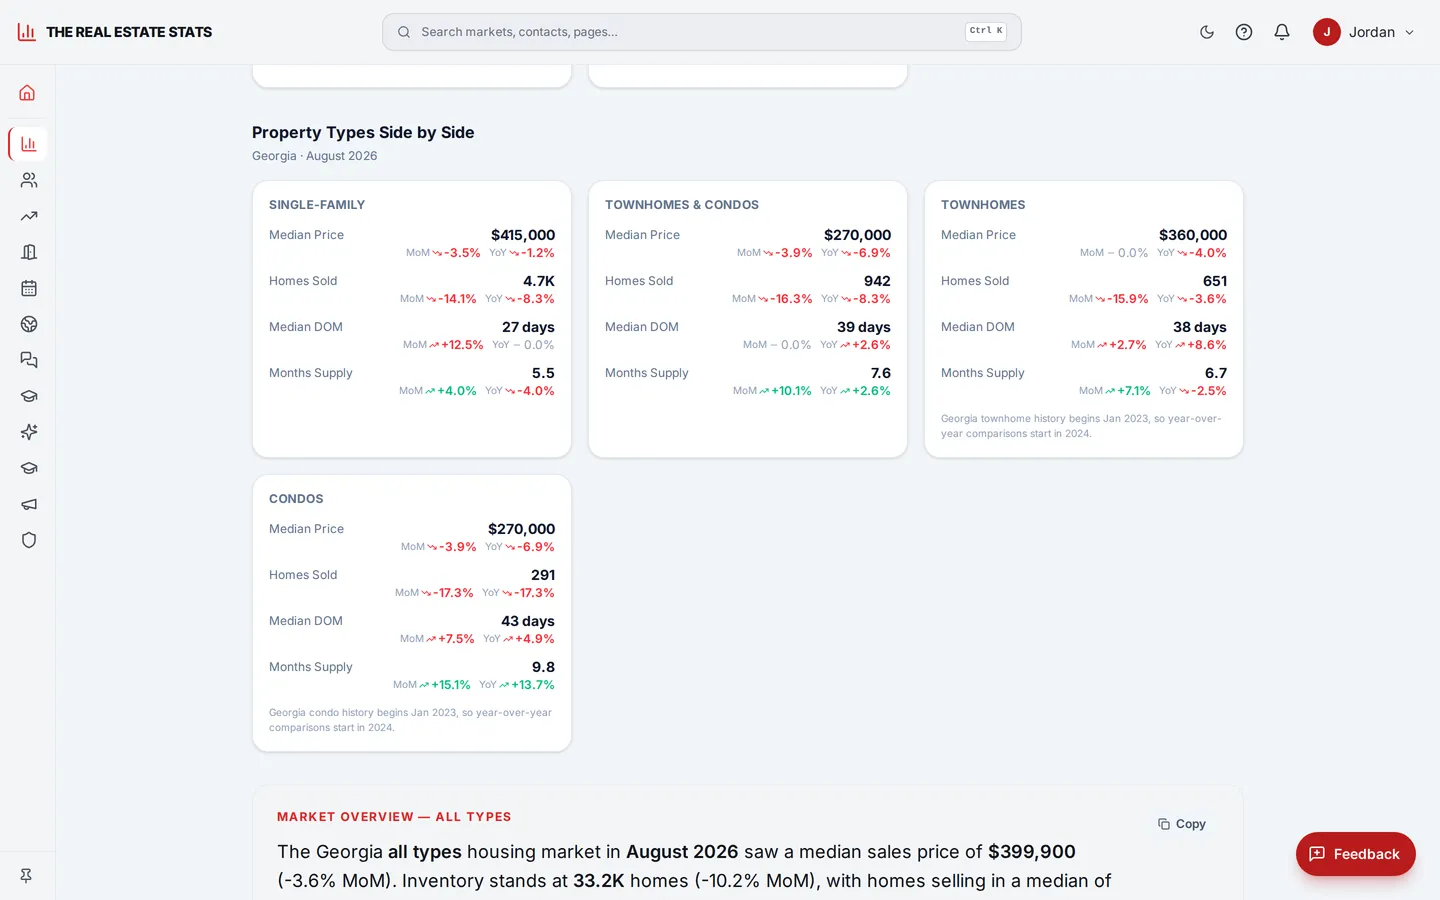
Closed sales, median and average price, price per square foot, days on market, list-to-sale ratio, inventory, months of supply, new listings, pendings, showings, price reductions — by property type (single-family, townhome, condo, and the combined attached market) and by price band across seventeen bands, monthly, with the prior year beside it.


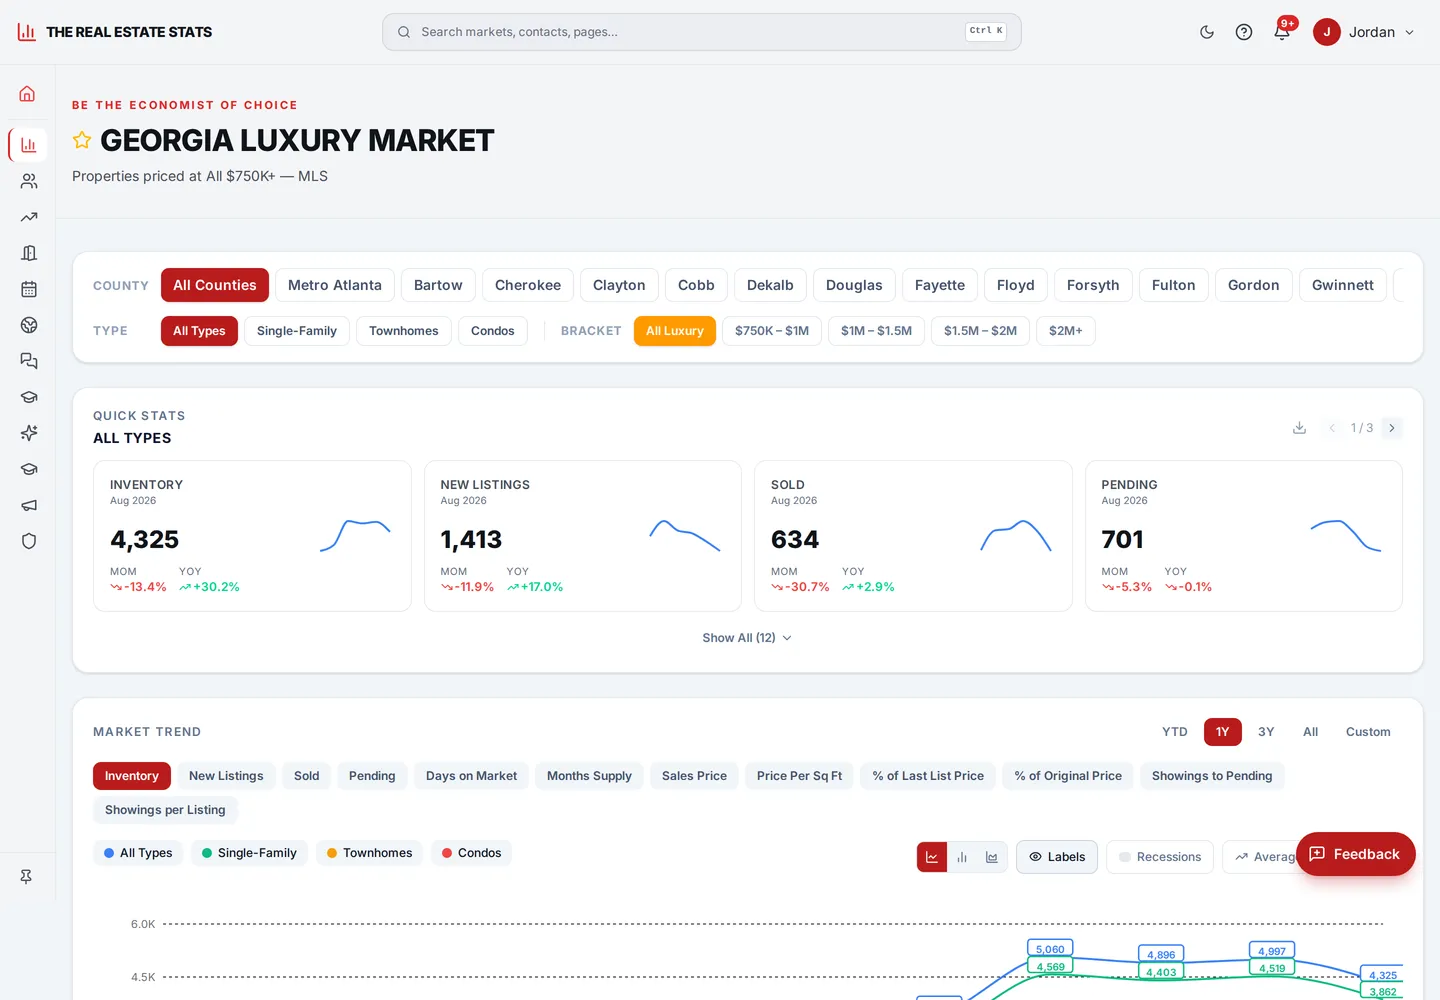
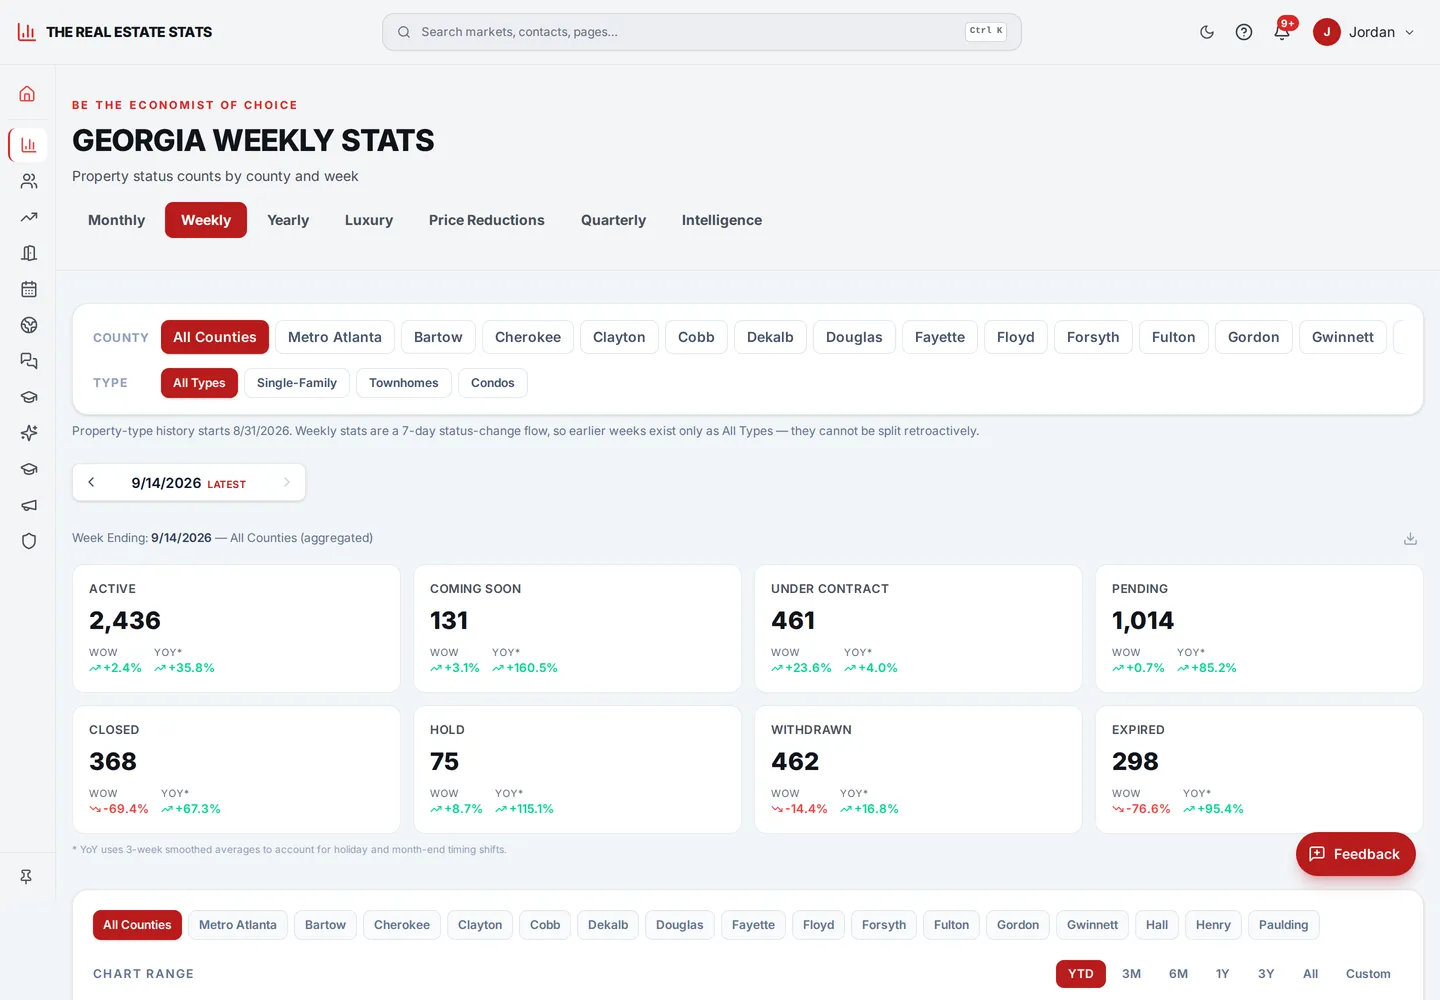
A dedicated luxury view by county and band; new-construction tracking where the feed supports it honestly; and a weekly view of what changed status this week — new, pending, closed, withdrawn — so leadership sees the market move before month-end.


Rates, employment and wages by industry, permits by structure type, who is moving in and from where, demographics and cost burden — every public series for your counties, kept as a permanent record and matched to the MLS numbers county by county. FRED, BLS and Census, so an ALC can say why the market moved, not only that it did.


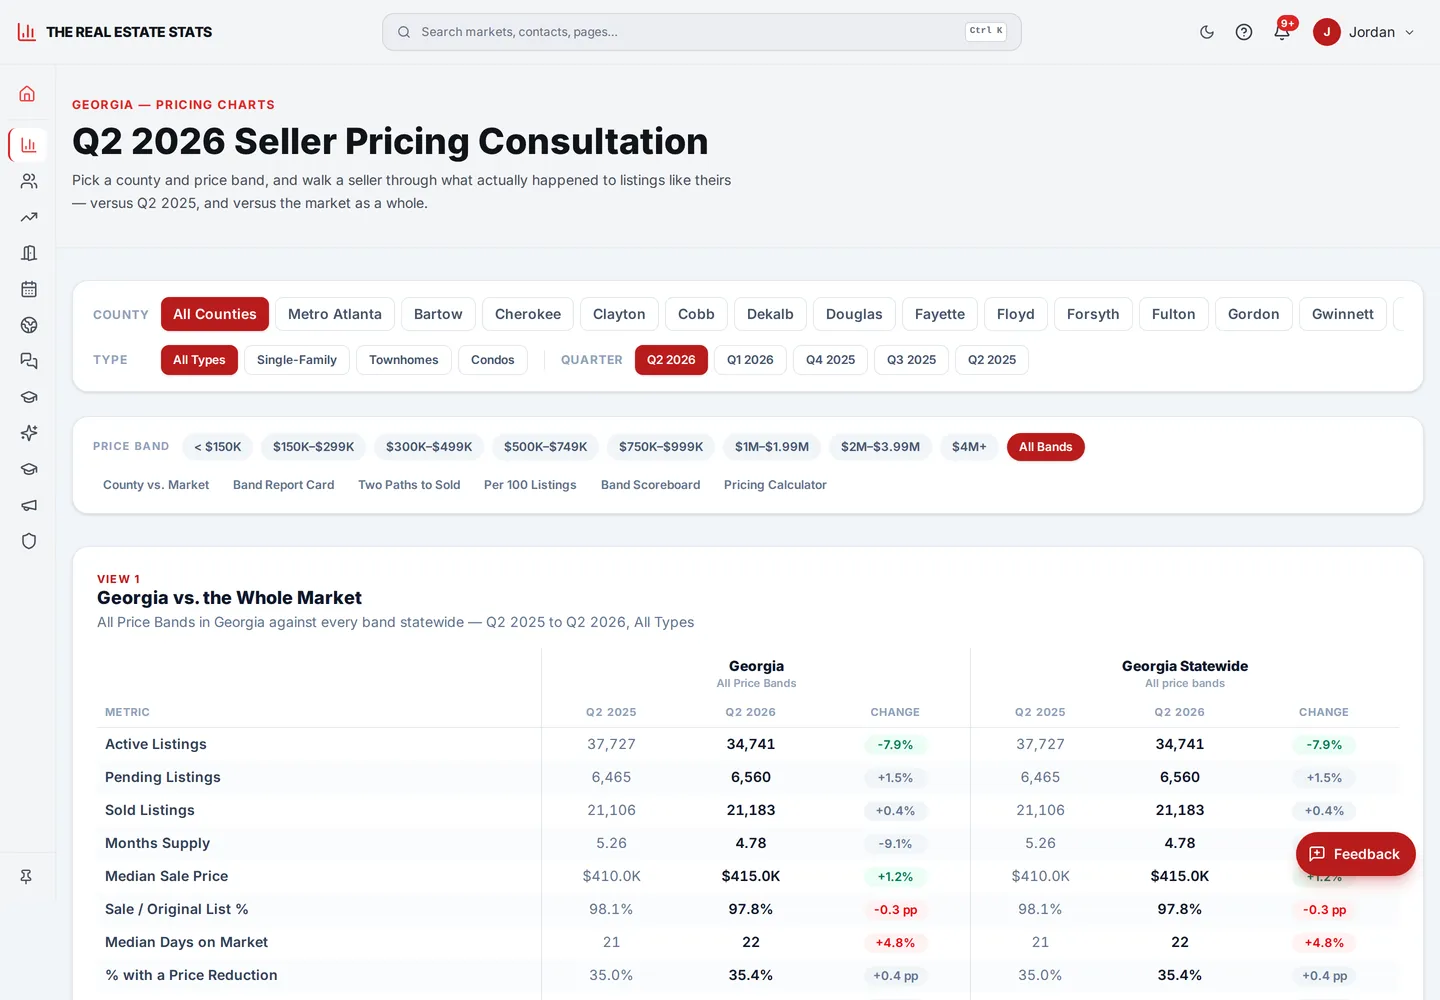
Charts an agent can put in front of a seller; a metric explorer on the map with category chips, and greyed-out clearly when a metric doesn't exist at that grain (inventory, for instance, is a county-level truth, not a zip-level one).


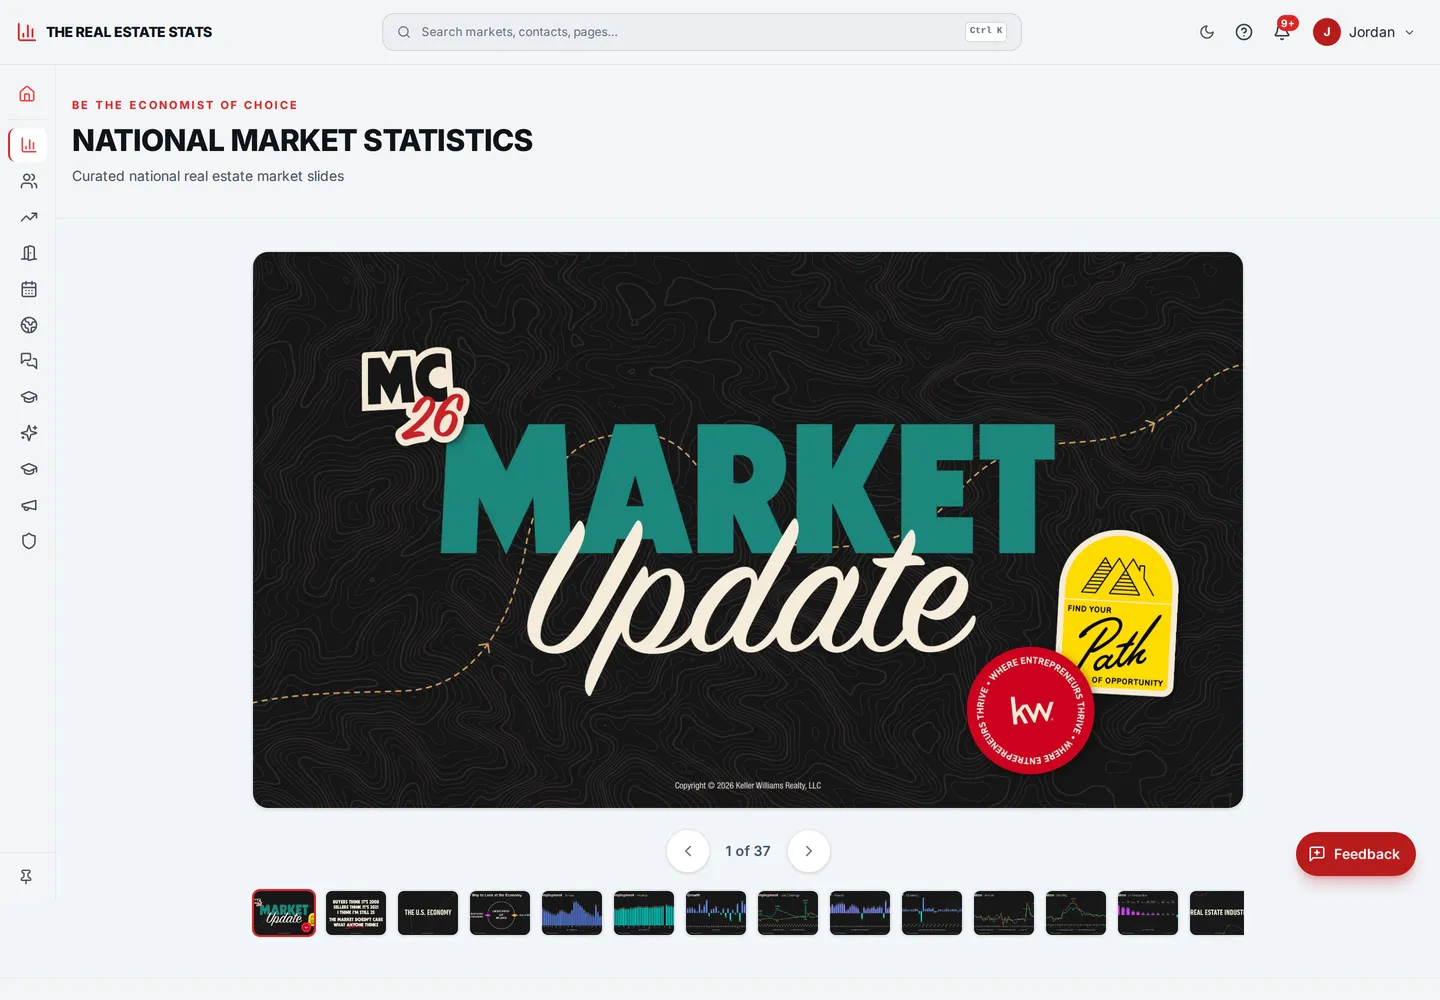
Market reports as PDFs with the Market Center's compliance band, presentation decks refreshed from live data with notes and QR short links, the weekly email in the classic report look, and CSVs for anyone who wants the rows. Every export carries its source and its date.

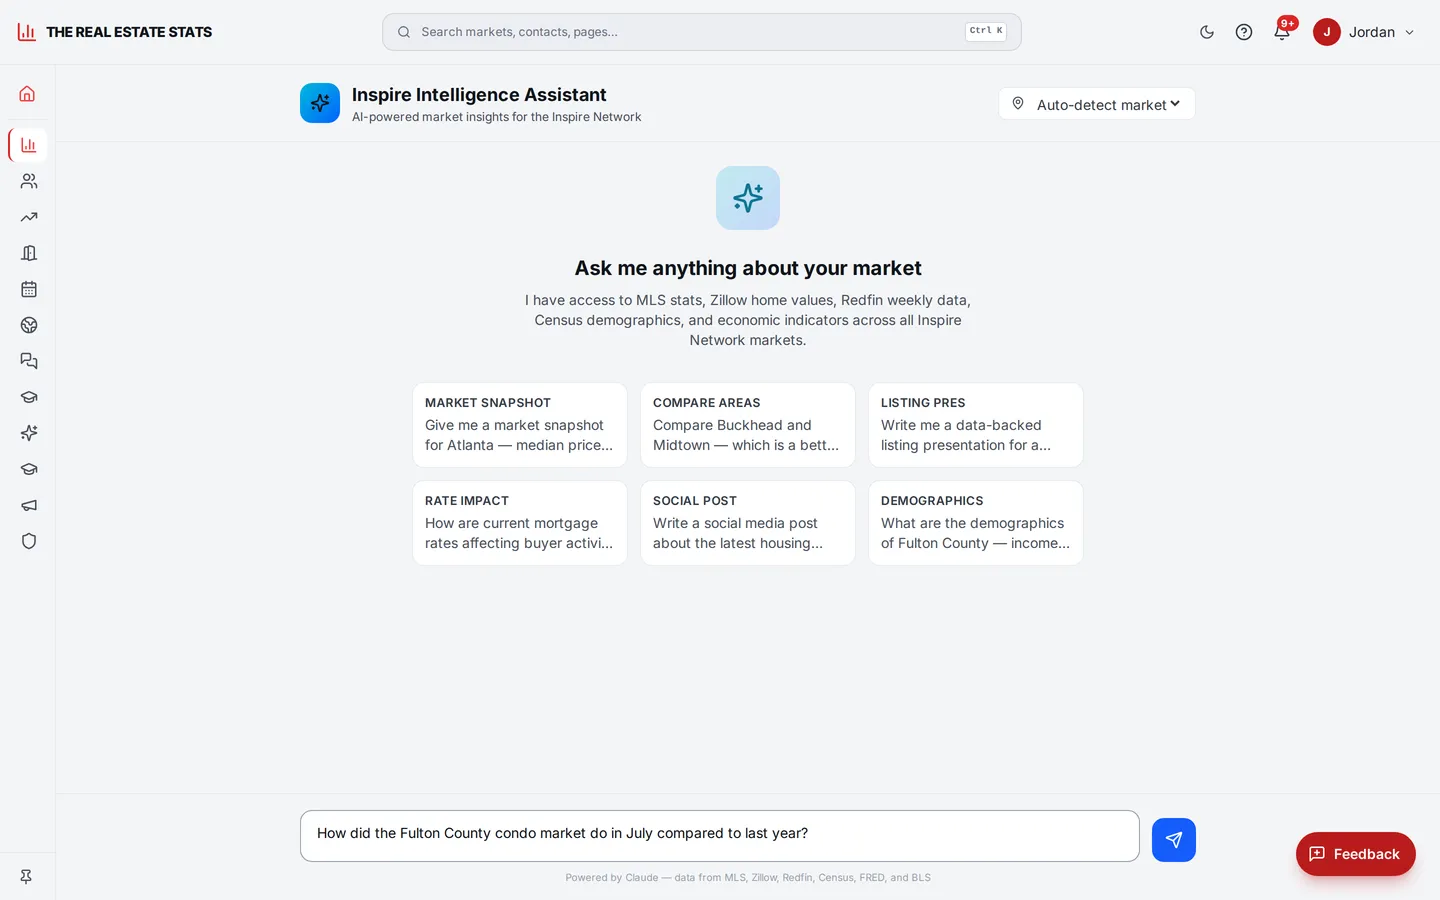
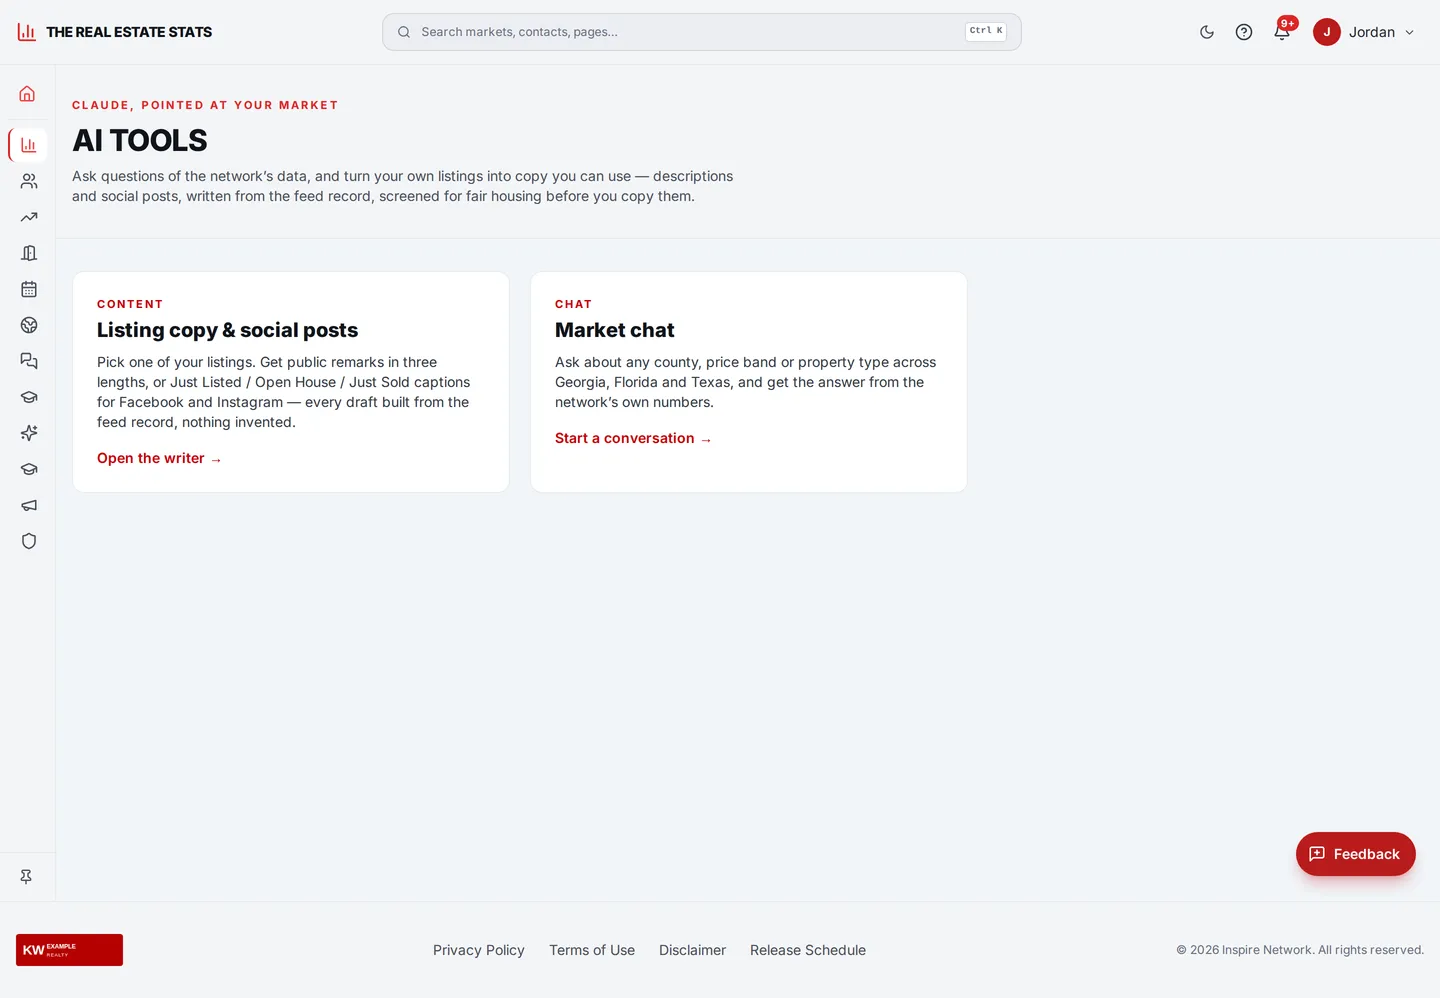
The Market Assistant answers questions against the same record — county, property type, price reductions, inventory — with the numbers behind the answer, streamed live. The AI tools beside it write listing copy and social captions from the agent's own listings, never from a template.


Screens above are the live platform with a generic office and cast. A walkthrough shows it on your feeds.